America’s zoning rules are everywhere—and nearly impossible to read
Want to know why a fourplex is legal one block over but banned on your street? The answer sits in zoning codes—thousands of pages written by thousands of local governments, each with its own definitions, exceptions, and fine print. Those rules shape what gets built and where: homes, shops, warehouses, schools, and the streets and parking that come with them. Yet for most people, zoning might as well be written in code.
A team at Cornell University is trying to change that. The National Zoning Atlas, developed by the Legal Constructs Lab and launched in 2022, is turning dense local ordinances into standard, plain-language maps. The goal: make zoning comparable across city and state lines, easy to search, and simple to explain. It’s a Rosetta Stone for land-use rules that, until now, have favored insiders with lawyers and time on their side.
The project is led by Sara Bronin, a professor in Cornell’s City and Regional Planning department and at Cornell Law School, who specializes in property and land-use law. Her team has set up a shared method for reading, interpreting, and mapping local codes so that a rule in Buffalo can be lined up next to one in Boise and actually mean the same thing on a map.
At its core, the atlas tackles a basic problem: zoning is local, but housing and economic challenges are regional and national. If state officials want to understand whether minimum lot sizes or hearing requirements are choking housing supply, or if school districts want to track how zoning choices shape student enrollment, they need common data. Until now, that data has been scattered, inconsistent, or locked in PDFs.

How the atlas works—and why it matters now
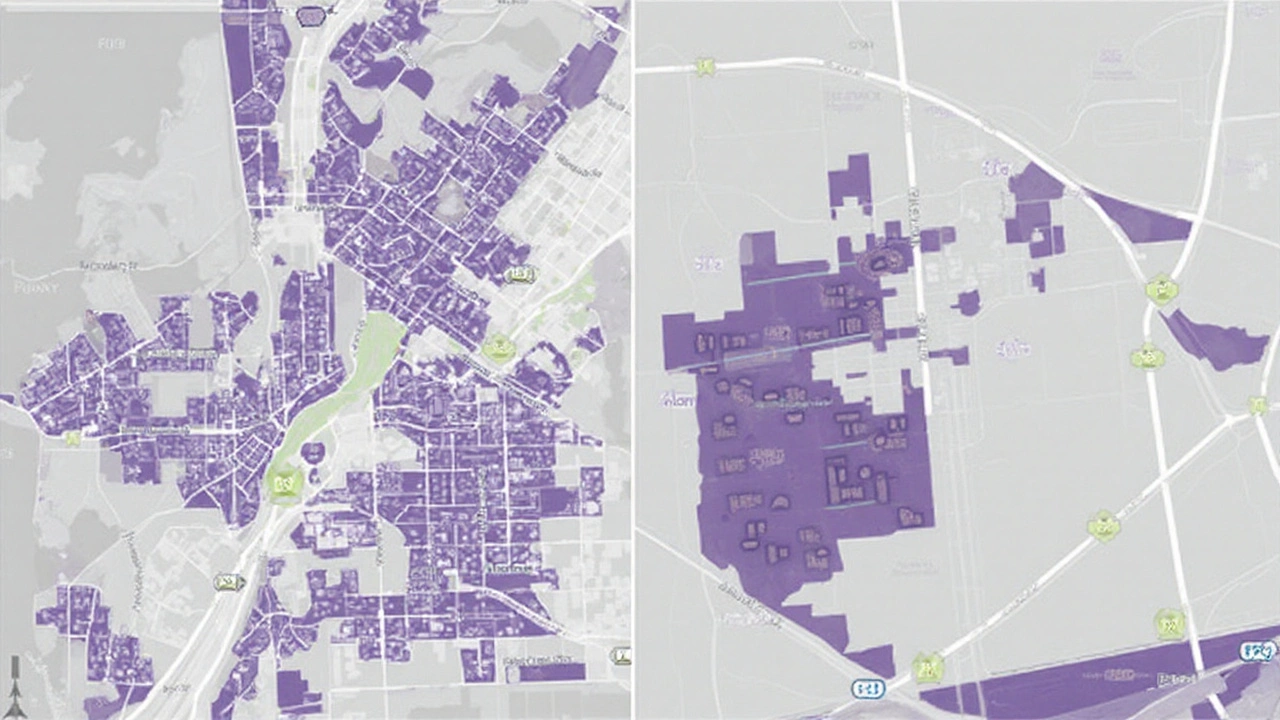
The atlas team reads zoning codes line by line to pull out comparable features: how many homes can be built on a lot, how tall buildings can be, and when public hearings are required. In many places, the work also captures the rules that often dominate local fights—like whether small apartments are allowed on single-family lots, whether mixed-use buildings are permitted near transit, and what kinds of review boards stand in the way.
Those rules are then merged with geospatial data so users see them on a map rather than hunting through legal text. Each zoning district becomes a clickable layer with clear, standardized labels. A student can look up where duplexes are allowed. A homeowner can see why a neighbor needed a variance. A reporter can compare two towns in minutes instead of weeks.
This isn’t a one-campus project. The National Zoning Atlas is a collaborative build-out involving more than two dozen state teams and over 50 institutions. The approach branched from the Connecticut Zoning Atlas model—an early proof that standardized mapping could cut through jargon and reveal patterns hidden in plain sight. That model set the tone: stick to what the code says, document it, and make it comparable.
The New York Zoning Atlas, one of the flagship efforts, launched April 19 at Cornell’s College of Architecture, Art, and Planning. Seed funding came from the Cornell Mui Ho Center for Cities, which focuses on practical fixes to urban problems like climate adaptation, mobility, and air quality. New York is a good stress test: it includes everything from tiny villages to the sprawl of the New York City region, each with its own rulebook.
Why does this matter now? Because the stakes are high. Cities and suburbs are confronting rising housing costs, climate risks, and infrastructure shortfalls. States are pushing reforms—loosening rules on accessory dwelling units, allowing more homes near transit, or curbing parking mandates. But you can’t measure change without a baseline. The atlas builds that baseline.
Consider the questions this data can finally answer with confidence:
- How much land in a region is reserved for single-family homes only?
- Where are apartments allowed as of right, and where do they trigger public hearings?
- Which suburbs require large lots that limit affordability and walkability?
- How many neighborhoods allow small corner stores or apartments over shops?
- Do parking rules make small infill projects financially impossible?
For policymakers, the power is in comparisons. A state housing office can see which towns permit duplexes and which don’t. A regional agency can spot barriers around transit stations. A school district can forecast how zoning choices might affect enrollment. Instead of relying on anecdotes, decisions can lean on mapped, verified rules.
The atlas also aims to level the playing field. Right now, when codes are hard to access, technical, and inconsistent, the advantage goes to those who can hire consultants. By translating codes into visual, searchable information, the project brings more people into the conversation—renters, first-time buyers, small builders, neighborhood groups, and students learning how planning works.
There’s a historical dimension here too. For a century, zoning has shaped American growth, backed by the 1926 Supreme Court decision in Euclid v. Ambler Realty. Over time, local codes expanded from basic use rules to elaborate systems that regulate building form, density, parking, and process. The result: a patchwork that can swing from permissive to restrictive in a few blocks, with big consequences for where jobs, schools, and transit go—and who can afford to live nearby.
What the atlas does not do is take sides on what zoning should be. It standardizes what is on the books. With that base in place, anyone—elected officials, advocates, researchers—can debate the right mix of rules for their community using consistent facts.
The practical uses are wide-ranging:
- City leaders can benchmark against peers before updating a zoning code.
- State agencies can monitor whether local rules align with statewide housing goals.
- Fair housing groups can evaluate whether hearing requirements and discretionary reviews create unequal barriers.
- Environmental planners can identify where zoning supports growth near transit and jobs, reducing long car commutes.
- Small developers can scope where missing-middle housing is feasible without years of variances.
The promise isn’t just transparency. It’s speed. Before the atlas, a cross-city comparison might take a research team weeks of reading and phone calls. With standardized layers, a statewide scan of where apartments are legal becomes a morning’s work. That speed matters when legislative sessions are short, grant windows close fast, and the housing market moves even faster.
The team’s method is built around consistency and documentation. Analysts record what codes say about units allowed, height, and process, then map those findings to a common set of categories. When local terms differ—say, one town’s “townhouse” is another’s “rowhouse”—the atlas normalizes definitions so users can compare apples to apples. Notes and sources are tracked internally so updates can be made when towns adopt new rules.
Quality control is an ongoing task. Zoning changes constantly. The atlas treats the map as a living dataset, adding jurisdictions and refreshing entries as communities update their codes. That matters for places experimenting with reforms—legalizing accessory dwelling units, reducing parking minimums, or allowing more homes near train stations. Those changes can be mapped quickly and seen in context.
There are limits. Zoning isn’t the whole story. Building codes, impact fees, infrastructure capacity, flood rules, environmental review, and market conditions all shape what gets built. The atlas won’t tell you whether a project will pencil out or whether a sewer line needs an upgrade. What it does is put the first, often murkiest piece—the local land-use rules—on clear display.
The equity angle runs through the project’s design. When information is scarce, it tends to flow to those with money, confidence, and time. Clear maps change who participates. A tenant group can show members where small apartments are legal. A first-time homebuyer can see which suburbs even allow modest starter homes. A town board can visualize how its rules compare to neighbors and ask whether differences are intentional or just inherited.
The atlas points toward bigger research questions, too. With enough jurisdictions mapped, analysts can study how zoning relates to commute lengths, school assignments, emissions, flood risk, and economic mobility. It opens the door to evaluating whether local codes support state fair housing obligations and whether process-heavy approvals fall harder on certain types of projects or neighborhoods.
States are watching. In recent years, legislatures have taken a more active role in land use, often in response to housing shortages. Some have legalized accessory dwelling units statewide. Others have chipped away at single-family-only zoning or trimmed parking mandates near transit. Whether those policies work depends on how local codes respond. The atlas can track that response in near real time.
Local governments may find the tool helpful, too. Many towns inherit zoning that’s decades old, layered with amendments that conflict on the edges. By seeing their map next to a peer’s, planning boards can spot where rules are out of step with community goals—like allowing jobs but banning homes near a growing employment center, or requiring large lots where infrastructure could support more neighbors.
Universities and nonprofits are central to the build-out. More than 50 institutions contribute legal reading, GIS mapping, and data verification. That cross-state network is how the atlas can scale without watering down local detail. Each state team adapts the shared method to the quirks of its local codes while keeping the core categories consistent.
New York’s launch offers a glimpse of what’s coming. The state’s mix—dense cities, small towns, and suburban rings—demands a flexible framework. The Cornell Mui Ho Center for Cities’ early backing signals a broader agenda: connect land-use rules to climate resilience, mobility options, and environmental health. As sea levels rise and storms intensify, the difference between building in the right place and the wrong one is measured in maps.
For journalists, the atlas narrows the gap between policy talk and on-the-ground rules. Stories about affordability or sprawl often stall when the code text is unreadable or inconsistent across towns. With a standardized map, it’s easier to confirm whether a proposed reform would change much or simply codify the status quo.
For educators, it’s a teaching tool. Planning and law students can explore how different jurisdictions regulate the same building type. They can trace why one corridor supports mixed-use buildings while another locked in strip malls and parking lots. They can see the trade-offs without getting lost in the footnotes.
The project’s next phase is about scale and depth: adding more jurisdictions, refreshing existing entries, and enriching categories where the data can support it. As the atlas grows, it should become possible to analyze trends across regions—where reforms are spreading, where rules are tightening, and how that maps to prices, rents, and commutes.
There’s a wider cultural shift at play, too. Public expectations for government data have changed. People want searchable, visual, and verifiable information. They expect to compare towns the way they compare products. Zoning hasn’t kept up—until now. By translating rules into a common visual language, the atlas brings a century-old system into the era of interactive maps.
If it succeeds at national scale, the payoff will be practical. Faster policy cycles. Clearer debates. Fewer surprises for residents and builders. And a shared factual base for questions that used to be answered with shrugs. The codes won’t get shorter. But they’ll be legible.


