
Financial markets roared back to life over December, boosted by news of potential breakthroughs on multiple COVID-19 vaccine trials. The confluence of Pfizer, Moderna, and AstraZeneca results increased investor confidence and expectations for a broad-based distribution of vaccines in the first half of 2021. Even discounting delays on the availability of the vaccine for the wider population, the immunization of healthcare workers, the elderly, and the more vulnerable parts of society should meaningfully alleviate the pressure on hospitals, and reduce the need for lockdown measures despite the absence of herd immunity. Next to their positive economic implications, these developments represent, first and foremost, a remarkable success for science and societies around the world.
This positive news flow comes at a time when the return of the virus is threatening the global recovery. While parts of the world, especially in Europe, may be experiencing a brief double dip recession in Q4 2020, financial markets are forward-looking and discounting the continuation of the recovery, considering vaccine news and ample monetary and fiscal support. The most notable shift in market performance has occurred with the long-awaited rotation from quality, momentum, and large-cap equities into value, mid-cap, and small-cap equities. We have been positioned for this rotation since June, and held on to it despite the noteworthy underperformance during the summer months. This rotation started in October, supported by a modest bear steepening in the yield curve, and sharply accelerated in November with positive vaccine news. Increasing investor confidence on a normalization of the economic cycle, particularly a recovery in face-to-face sectors, has benefited value and (small) size factors given higher operating leverage and higher sensitivity to the economic cycle compared to large-cap, quality, and low-volatility stocks. This shift has led to a reversal in the momentum factor, and in the relative performance between sectors that benefited the most during the pandemic, namely technology, health care, and communication services, versus sectors that were negatively impacted by lockdowns such as energy, industrials, materials, and financials. We expect these trends to continue.
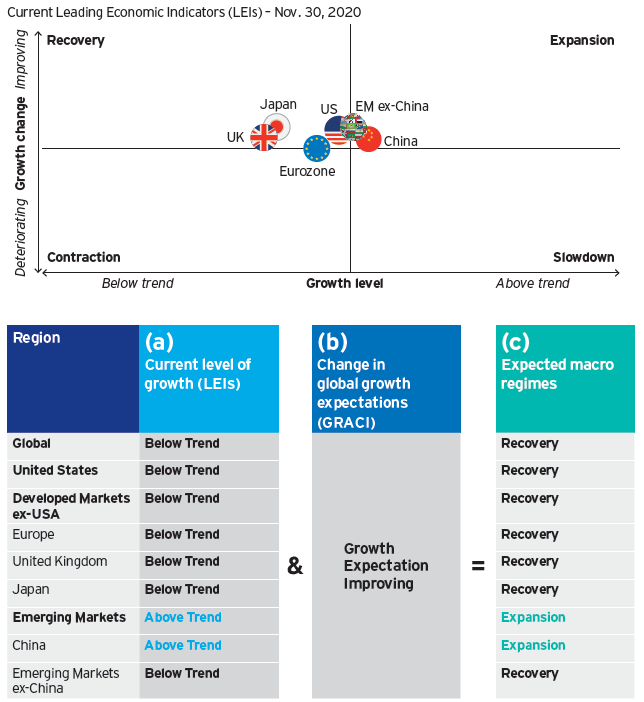
Based on our macro regime framework, we expect the global recovery to continue, with emerging markets (EM) to expand and grow above trend and developed markets to follow soon after as they approach trend growth. Within the developed world, Europe is lagging given the more stringent lockdown measures following the second wave.
Figure 1: Leading economic indicators and market sentiment suggest the global recovery continues, despite rising infection rates and renewed lockdowns in part of the world.

Despite the large moves in global financial markets, we implemented no meaningful change in December to our asset allocation. We expect the global recovery to continue and anticipate a supportive environment for equity and credit premia, cyclical factors, and risk assets more broadly.
We maintain a higher risk posture than our benchmark1 in the Global Tactical Asset Allocation model, sourced through an overweight exposure to equities and credit at the expense of government bonds. In particular:
Within equities, we hold large tilts in favor of emerging markets compared to developed markets, driven by favorable cyclical conditions, improving risk appetite, attractive local asset valuations, and a depreciating US dollar. We are neutral between US and developed ex-US equities, as per the change implemented in our last update, given the weaker growth momentum in Europe. However, it is worth noting the meaningful outperformance in European equites over the past month, which we attribute to the “value characteristics” of this market compared to the US, benefiting from the style rotation discussed above. We are capturing this rotation theme within US equities and continue to hold tilts in favor of value and (small) size factors, at the expense of quality, low volatility, and momentum equities (Figure 3).
In fixed income, we maintain an overweight exposure to US high yield credit and emerging markets sovereign dollar debt at the expense of investment grade corporate credit and government bonds. We remain constructive on risky credit despite the steady compression in spreads since March. As the cycle matures, moving from a recovery to an expansion regime, financial markets volatility tends to decline, turning the investment case for credit from capital appreciation (i.e., spread compression) to income generation. Finally, we favor US Treasuries over other developed government bond markets. Overall, we are overweight credit risk2 and moderately underweight duration versus the benchmark.
In currency markets, we maintain an overweight exposure to foreign currencies, positioning for long-term US dollar depreciation. Within developed markets we favor the euro, the Canadian dollar, and the Norwegian kroner. In emerging markets, we favor the Indian rupee, the Indonesian rupiah, and the Russian ruble.
Figure 2: Relative tactical asset allocation positioning

Figure 3: Regime-dependent factor exposures – Dynamic (shaded) versus benchmark (black)

Important information
Blog header image: Gokhun Guneyhan / Unsplash
The yield curve plots interest rates, at a set point in time, of bonds having equal credit quality but differing maturity dates to project future interest rate changes and economic activity.
The Russell 1000® Index, a trademark/service mark of the Frank Russell Co.®, is an unmanaged index considered representative of large-cap stocks.
The MSCI ACWI Index is an unmanaged index considered representative of large- and mid-cap stocks across developed and emerging markets. The index is computed using the net return, which withholds applicable taxes for non-resident investors.
The Bloomberg Barclays Global Aggregate Bond Index is an unmanaged index considered representative of the global investment-grade, fixed-rate bond market.
A value style of investing is subject to the risk that the valuations never improve or that the returns will trail other styles of investing or the overall stock markets.
The risks of investing in securities of foreign issuers, including emerging market issuers, can include fluctuations in foreign currencies, political and economic instability, and foreign taxation issues.
Stocks of small and mid-sized companies tend to be more vulnerable to adverse developments, may be more volatile, and may be illiquid or restricted as to resale.
Fixed-income investments are subject to credit risk of the issuer and the effects of changing interest rates. Interest rate risk refers to the risk that bond prices generally fall as interest rates rise and vice versa. An issuer may be unable to meet interest and/or principal payments, thereby causing its instruments to decrease in value and lowering the issuer’s credit rating.
Junk bonds involve a greater risk of default or price changes due to changes in the issuer’s credit quality. The values of junk bonds fluctuate more than those of high quality bonds and can decline significantly over short time periods.
In general, stock values fluctuate, sometimes widely, in response to activities specific to the company as well as general market, economic and political conditions.